(Takes a little while loading the images)
e-mail :

Sequel-13 to the Summary and Evaluation (of the documents XVI -- XXVIII concerning the promorphology of complex-shaped two-dimensional crystals).
This document (Part XXIX Sequel-13) further elaborates on the analogy between crystals and organisms.
Introduction
Having established (previous two documents) the theory of organic lattices, based on the findings in snow crystals (still earlier documents) and on the need to account for the orderly spatial distribution of biological elements during organic morphogenesis, it is now time to systematically explore the existing analogies between crystals and organisms.
We can do so because we have uncovered the possible cause of these analogies, or at least one of the causes. This possible cause is the assumed organic lattice in organisms, which implies that we now can say that both organisms and crystals possess a lattice, accounting for their spatial structure. So these analogies could be (partially) explained by the presence of such a lattice, which in fact constitutes an argument in favor of the presence of such an organic lattice in organisms. But we must admit that an argument of that sort can never be a very convincing one, because all the analogies between crystals and organisms could well turn out to be merely trivial similarities, not in any way fundamental and significant : There is, for example the growth analogy. Crystals do grow, as long as they find themselves in a suitable nutrient environment. There are even indications that the growth of crystals involves certain maxima. Also organisms do grow when situated in a suitable nutrient environment. In animals more or less definite maxima of attainable size are present, while many plants seem to be able to grow more or less indefinitely.
But growth, generally taken, is just an increase in size, which can happen everywhere, for example in mountain building as a result of an uplift of parts of the earth's crust, the increase in size of sand dunes when more and more sand grains accumulate by the action of the wind, and all other kinds of physical inflations. So the analogy could be trivial. Especially when extensive generalization is applied to certain concepts or types of processes, similarities appear even in unrelated phenomena.
However, we could retort that genuine growth is not just some increase in size and nothing more, but an orderly and repeatable increase in size of an intrinsic being, and as such we see it only in crystals and organisms. It is true that organic growth is much more subtle than crystal growth, so it remains an analogy. But because of the regularity and repeatability, resulting in the intrinsic nature of the particular way of growth of a given crystal or a given organism, the analogy is, in my opinion, not trivial.
The same applies to many other analogies between crystals and organisms.
So we'll take the crystal analogies seriously. And, as has been said, they are, at least partly, based on the supposed organic lattice in organisms. This organic lattice is meant to be a point lattice (quasi or true) where the points are provided with certain chemical units, motifs. And such a lattice + motifs, i.e. a specified point lattice + fully specified motifs, defines a crystal. The morphology (not only the symmetry) of the translation-free residue determines the promorph or stereometric basic form of the crystal. And in the case of an organic crystal (resulting from an organic lattice) it is clear that its promorph determines the promorph of the o r g a n i s m possessing this organic crystal. As in any crystal, the number and configuration of its antimers can be expected (also) to be indicated by the configuration of outgrowths as they appear when the crystal grows fast, i.e. when the crystal is the result of non-equilibrium crystallization.
So while the promorph of a true crystal is based on its specified lattice + specified motifs (and from there (based) on the morphology of the translation-free residue), the promorph of an organism is an effect of the organism's underlying o r g a n i c lattice + motifs (both fully specified). However, the fact that organisms clearly do have a promorph cannot be used as a argument in favor of the presence of an organic lattice, because they can have a promorph without it, i.e. also structures that are in no way periodic do have a promorph.
To my knowledge, the most extensive exposition of the crystal analogy is offered in some of the works of H. PRZIBRAM (who influenced great embryologists like R. HARRISON), especially his Die anorganischen Grenzbebiete der Biologie, 1926 (205 pages), where he explores a series of basic properties of organic and inorganic materials, comparing them, and using them for a theory of organic lattices.
Unfortunately this book is old (1926), and we can expect many details to be obsolete. Especially, in that time, little was known about the molecular basis of heredity. But it is the most recent book, extensively discussing this topic, I could lay my hands on. Therefore, in the present document, which is meant to be devoted to a presentation of a systematic crystal analogy, I will discuss this book's contents.
Apart from problems arising from its ancient date of appearance, the topic, discussed in this book, is a hard one already all by itself, because it requires acquaintance with many different disciplines, like physics (thermodynamics, hydrodynamics), chemistry (inorganic and organic), crystallography, mathematics, organic morphology, physiology, embryology, etc. Already for a long time, all these disciplines cannot be mastered at the same time by one and the same person. So the value of the content of such a book, like that of PRZIBRAM, as well as a modern commentary of it, is very limited indeed. Therefore my intention, when discussing the findings and ideas of this book, is not to give a body of technical and reliable knowledge, but to stimulate further reseach, or stimulate just a way of thinking about organisms and crystals. And this 'thinking about organisms' could consist of a further working-out of the theory of organic lattices, especially the version presented on this website, because this version does away with a number of problems inherent in PRZIBRAM's version. So it is the frame-work and the approach of the book (and my discussion of it), that is the most important aspect, not the many of its technical details (which should be re-checked).
While PRZIBRAM was thinking more or less in terms of real crystal lattices (of either solid crystals -- sterro-crystals, or liquid crystals -- rheo-crystals), our investigations, as were carried out in the previous documents, came to the conclusion that an organic lattice is conceptually and physically far more removed from a physical crystal lattice. For example it allows for its deformation while still remaining that same lattice, and can often act independently from the actions of other chemical units that are present within its interstitional space, both capabilities made possible by assumed compensating-reactions, unthinkable of in real crystals. Moreover, it is not the organism in the more strict sense that is crystalline (or quasi-crystalline) : The organsmic organization of cells and tissues is something profoundly aperiodic. The supposed organic crystallinity is only a more or less hidden aspect of the organism, providing for some sort of spatial pre-design. The motifs at its lattice points could be centers from which emanate material or energetical gradients, instead of just being chemical units that only locally interact with each other resulting in their patterning. The organic lattice could even be no more than a convenient metaphor to describe organic structure, causing it to be analogous in a much stronger sense. Indeed, we know for sure that organisms are not crystals, also not non-equilibrium crystals. And the aspect of spatial organization and structure, for which to account we invoked organic lattices, is only one the many aspects of organic development. Another, and very important aspect, not accounted for by organic lattices, is the time aspect, i.e. the organization in time. We believe that much of this time aspect, consisting of the right time order of events in development, is taken care of by the organism's genome, its system of genes.
The fact that we devote so much attention to the spatial aspect of organisms and of their individual development is not that we consider it the most important feature, but because of the lack of attention it nowadays receives (apart from some ideas of positional information, material gradients, and the like). This lack of attention is probably due to the very promising genetic investigations (especially in molecular biology) which have already revealed so much for the understanding of life. But, as some authors have stressed, DNA cannot account for all features of life, and it can certainly not account for all spatial aspects in individual organisms.
As to the organic lattice, it is possible that more than one lattice, are involved, i.e. several more or less independent and partially overlapping lattices (as PRZIBRAM assumes) underlie the organism's spatial structure and spatial development.
So it is in the context of all the above that we must discuss PRZIBRAM's book on the crystal analogy.
PRZIBRAM, systematically considers certain phenomena, states, properties, processes, behavior and abilities that are being observed in organisms, and that seem to be peculiar to the latter. He then shows that these phenomena, states, etc. are also present in the inorganic world, albeit often in a more or less simplified version. In fact he demonstrates analogies, (and also smooth transitions), first of all between the organic and inorganic world, and sometimes, more specifically, between organisms and crystals. The motivation to do so is to demonstrate that the organic does not possess some fundamental 'extra' over and above the inorganic. In this way he argues against the vitalistic position, as for, instance held by his contemporary DRIESCH. Along these lines he hopes then to become more specific by arguing that these analogies point to the existence of some periodic spatial point system (organic lattice) in organisms, and thus, because in crystals the presence of such a lattice is already definitely established, setting up a crystal analogy. In this way then one feature after another is discussed within this context.
First of all, under the heading of "MORPHE", he discusses morphological (in the broad sense) phenomena (like state of aggregation (solid, liquid, etc.), state of dispersion (true solution, colloidal solution), basic form (promorph), growth, regeneration, etc.), then, under the heading of "PHYSIS", he discusses energetic statics, energetic dynamics, and energetic kinetics. Finally, under the heading of "STEREOCHEMISTRY", he discusses the features of, and directly connected with, the microstructure as we find it in crystals, and (as organic lattices) in organisms.
In commenting on all these features and phenomena, we must realize that PRZIBRAM'S book is from 1926, implying that some of his scientific background and, consequently, the corresponding conclusions drawn from it, could be more or less outdated. Moreover, some of the arguments, are more or less unclear, or are not so important anymore in the modern context.
Many of PRIZIBRAM's arguments involve areas of physics and chemistry that are not so familiar to me (making me heavily relying upon the writings of the several authors that are experts in these fields of enquiry).
For consulting the scientific backbround of PRZIBRAM (in order to understand and evaluate his arguments), I have, among other sources, made use of the Handwörterbuch der Naturwissenschaften, Ten Volumes (I--X), published in 1912--1915. We will refer to it as HW-NAT (191x, Volume n, p.m). Apart from giving us something of PRZIBRAM's scientific background, this extensive dictionary, compiled by many specialists of the time, contains -- if we limit ourselves to its general 'textbook' findings on classical physics and classical chemistry, and do not consider all too seriously certain molecular or atomic hyphotheses and other aspects liable to being superseded by new insights -- much information that is still valuable today, certainly when it is used for more general qualitative and philosophically oriented discussions, as they are taking place on this website.
For commenting PRZIBRAM's theory, it was also necessary to consult books of a more recent origin, that consider some of the mentioned phenomena. Among these books are : Introductory Chemistry, by R. OUELLETTE, 1970, (referred to as OUELLETTE, 1970) and Disigning the Molecular World, Chemistry at the Frontier, by Ph. BALL, 1994, (referred to as BALL, 1994).
In commenting on the expositions of PRZIBRAM (in his mentiond book -- 1926 -- on the crystal analogy, 205 pages) we will then proceed as follows :
Where necessary, we will begin with a general exposition of the feature or phenomenon that PRZIBRAM is about to discuss in the relevant section of his book. After that we will discuss and evaluate PRIZIBRAM's argument with respect to that particular feature. Then we take the next feature, discussed by PRZIBRAM, and again, when necessary, we start with a general exposition about that feature, followed by a discusssion and evaluation of PRZIBRAM'a argument in with this feature plays a role. etc.
However, in order not to interrupt the arguments too long and too often, we shall first give a general exposition of some important topics, such as the thermodynamics with respect to crystallization and the theory of liquid crystals.
The ensuing exposition is about the conditions that must be satisfied for a chemical or physical transformation to be possible at all. We will focus as much as we can on the crystallization process, and especially that process in which only one chemical compound is involved (for example the formation of snow crystals from water vapor). Such a system is a so-called one-component system. Let us start with the theory of phases, that is to say the theory that considers the possible existence of a given phase and the coexistence of several different phases (like, for instance ice-water-steam).
We will derive the phase rule which, by means of an equation, relates, in a given system, the number of phases (P), the number of independent components (C) (as types, not as particles) and the number of degrees of freedom (F). This phase rule reads :
In order to derive this rule, we must first clarify some conceps (In what follows, viz., concepts and derivation, is taken from HW-NAT (1912, Volume VII, pp.678).
Phases, in the sense of the theory of phases, are spatial states, and thus states of aggregation. So there are solid, liquid and gaseous phases (Colloids also represent a certain state of aggregation. But for colloids surface tension is highly important to their resulting form. And because in the ensuing derivation of the phase rule surface tension is neglected, the phase rule, at least in its ordinary form, does not apply to colloids).
In a heterogeneous system many solid phases can be present, but maximally only two liquid phases, and only one gaseous phase. A characteristic feature of a phase is its homogeneity. In contrast to a chemical compound, a phase, in its molecular dimensions, does not need to be an intrinsic unity, or body. Consequently a mixture of gases, a solution or a mixed crystal, represents one single phase.
Independent components (or, simply, 'components') of a system are those components that cannot be produced by the mixing of other components of the system. The selection of these independent components must comply with two conditions : (1) Every possible change in the composition of phases of the given system must be expressible by the change in quantity of these independent components. (2) The latter changes must be independent of each other.
So one must select the smallest possible number of independent components.
For systems which interest us most, viz., the crystallization of a single compound from its solution, from its melt or from its vapor, the number of independent components (C) is 1.
The degree of freedom (F) is the difference between the number of variables of a given system and the number of equations that determine these variables.
For example if have one variable and one equation determining it, then this variable is totally determined, i.e. it is fixed, and consequently is has no degree of freedom, or could we say, the number of degrees of freedom is zero. Such a variable could be x, and the equation could be 2x + 5 = 0, implying that x is fixed to be equal to minus two and a half (-5/2).
If, on the other hand, we have two variables, x and y, and only one equation, say, 2x + y = 5, then when x is determined then also is y . When, however, x gets a new value, different from the first one, then the value of y will be different too. The number of degrees of freedom is now 1, because only either x can be varied (and then fixing all the corresponding values for y), or y can be varied (and then fixing all the corresponding values of x).
Most fundamental are the First and Second Laws of Thermodynamics.
The botom line of these laws is that they reject the possibility of a perpetuum mobile . (i.e. a machine that keeps on running without the need for further and continued (re)fuelling). The possibility one kind of perpetuum mobile is denied by the First Law, while a second kind is denied by the Second Law.
The First Law can be stated mathematically as follows :
Where dQ is the amount of heat supply,
dE is the increase of interior energy of the system,
dV is the increase of volume, and
p is the pressure.
The Second Law can be stated mathematically as follows :
Where " / " means 'divided by',
dS is the increase of entropy,
T is the absolute temperature, and
DELTA is a positive quantity (in the limiting case : zero).
Entropy (S) is a measure of disorder of the given system.
The First Law can verbally be stated as being the principle of the conservation of energy (and 'energy' is capacity to perform work). According to this law, energy is never destroyed, but only transformed from one kind to another.
The Second Law can verbally be stated as follow :
All realizable transformations are accompanied by an increase in the total amount of entropy in the Universe (Strictly speaking, it says that the entropy cannot decrease. There is a class of transformations -- those that can be reversed exactly -- for which the entropy content of the Universe can remain unchanged). (See BALL, 1994, p.57).
The above given mathematical expression of the Second Law can verbally be read as follows : Even when the supplied heat dQ is zero, i.e. even when the interior energy (E) and the volume (V) of the system remain what they were, (making dQ / T equal to zero), the change in entropy is still positive or zero, i.e. it does not decrease : dS (E and V constant) = DELTA. So in a closed system the entropy (S) remains either the same or increases, dS = 0 or dS > 0.
The " divided by T " in the mathematical expression of the Second Law, can, I think, loosely be interpreted as preventing dS (change of entropy) to rise indefinitely.
About the Second Law BALL, 1994, p.57, writes the following :
These days, entropy is a term not uncommon in everyday parlance, but it has acquired a certain air of mystery. There is, however, nothing very mysterious about it at all. It can be regarded as a measure of disorder -- a pile of bricks, for instance, has more entropy than a house. Similarly, a liquid has a greater entropy than a crystal, since [ in ] the former the molecules tumble about in disarray while in the latter they are stacked in an oderly, regular pattern [Nevertheless a crystal can spontaneously emerge from a melt or solution, because the entropy ends up in the crystal's environment, and it is the total entropy count that matters ] . The Second Law is therefore saying that the Universe is bound to become ever more disorderly. This too can appear to be a very recondite and mysterious statement, but in fact it is saying nothing more than that things tend to happen in the most probable way : there is simply a greater probability that things will become disordered than the reverse. The Second Law is therefore actually a statistical law, which does not prohibit absolutely the possibility of a change that induces a decrease in entropy, but says only that such a change is overwhelmingly unlikely when we are considering huge numbers of molecules [ because they admit of many many different configurations, and most of them are disordered ].A chemical reaction is feasable if there is an overall increase in entropy of the system and its surroundings (the latter being an effective representation of the rest of the Universe). This means that, for example, if the products have less entropy than the reactants (the starting materials), this decrease must be more than balanced by an increase in entropy of the surroundings due to the heat given out or the work done via volume changes (See BALL, 1994, p.58).
Willard Gibbs (a nineteenth century scientist) expressed the directionality criterion in terms of a quantity called the Gibbs free energy, which quantifies the net effect of the various contributions on the total change in entropy during the transformation. These contributions are :
But even when a given transformation happens to be geared towards a boost for the total entropy of the Universe, which is to say, going to effect a large decrease in Gibbs free energy, it often doesn't get started. Indeed, the Gibbs free energy criterion, i.e. the thermodynamics, only decides whether a particular transformation is physically feasable at all. What hinders the transformation from actually proceeding is the kinetics of that transformation.
Indeed, the initial step of a transformation is generally an uphill process : energy must be supplied to get things going. That is, that although a transformation can itself be a downhill process (which means that it does not need to be sustained by energy supply from without), it can involve an energy barrier, that must be taken, before the transformation will proceed and will be self-supporting. This is the case when we ignite paper in order to burn it. And the same is the case in supercooled liquids. These are liquids that ought to be in the solid state, but still are not. But one or another disturbance (which we can interpret as an energy nudge) sets solidification in motion, the liquid freezes. While the difference in Gibbs free energy involved in a transformation, determines the position of the equilibrium of the transformation, the kinetic hindrance controls its speed. But apart from this initial barrier -- which makes a system to be in an unstable state possible (especially relevant when this barrier is very small) -- the Gibbs free energy (and also the thermodynamic potential, which we assume to be equivalent) must decrease. BALL, 1994, p.58, remarks that strictly speaking, this latter is true only when the temperature and pressure of the system are held constant. Under different conditions, other kinds of free energy must be considered instead of that defined by Gibbs. But if everything has free play, then in phase transitions (which are our main concern here), like the formation of snow crystals or the melting of a metal, pressure and temperature indeed remain constant.
Because of the difficulty to understand all the factors involved in chemical and physical transformations, including phase transitions, we will cite yet another author, who gives a qualitative account of the thermodynamic feasability and determination of the direction of transformations, using the concepts of ENTHALPY, ENTROPY and FREE ENERGY (the latter I assume to be the Gibbs free energy mentioned earlier). The quote is from R. OUELLETTE, Introductory Chemistry, 1970, p.211--212 [comments between square brackets] :
The equilibrium state for both physical and chemical systems can be treated quantitatively by means of thermodynamics. While the concepts and implications of thermodynamics will not be covered rigorously in this text, there are certain basic features that can be qualitatively described [...] .(End of quote)
There are many physical and chemical processes that occur naturally. The flow of water downhill and the expansion of a gas to fill a container are two examples of spontaneous physical processes. The reaction of hydrogen and oxygen to yield water and the burning of wood are examples of chemical processes. Analysis of all naturally occurring processes reveals that two fundamental features control them. Most [ and thus not all ] systems tend to produce a state of lower energy [ not to be confused with the Gibbs free energy, i.e. this energy is not yet the Gibbs free energy ] and as a consequence release the net energy difference between the initial state and the final state. The reverse process is less common and can occur only if the second controlling feature, entropy change, is favorable [ and that means that the total entropy increases ] . The flow of water downhill and liberation of heat in the formation of water from hydrogen and oxygen occur because a state of lower energy is achieved. In such cases the energy difference between initial and final states is called the change in enthalpy, delta H. By convention the liberation of energy is given a negative sign. For example, the reaction
CO2 + H2 ==> CO + H2O liberates 9830 cal for each mole of CO2 that reacts. The enthalpy change, delta H = - 9830 cal/mole, reflects the fact that the products CO and H2O are more stable than CO2 and H2 by 9830 cal/mole.
The second controlling feature of all processes is the tendency of a system to achieve the most random or disordered arrangement possible [ because such arrangements are the vast majority of all logically possible arrangements, and are therefore, as a class, more probable ] . This feature is important [ i.e. dominant ] in the expansion of a gas or the vaporization of a liquid [...]. The degree of randomness or disorder is called the entropy of a system. By definition the entropy change (delta S) is positive for increasing disorder. The entropy change counterbalances unfavorable enthalpy changes in some systems. If the increase in the degree of disorder is great, an endothermic process can occur [ an endothermic process is a process that must be supplied by energy from without if it is to be maintained ].
The temperature is a significant factor in determining the relative importance of enthalpy and entropy contributions to a system that can undergo change. At absolute zero all substances are ordered and entropy differences between two or more substances are zero. Therefore, only their relative energies determine their relative stabilities. With an increase in temperature a variety of molecular motions become[s] possible, and the tendency toward disorder changes from substance to substance. The differences in entropy can play a variable role as a function of temperature. At extremely high temperatures the entropy differences between various substances may play a dominant role in the course of a reaction.
The relationship between enthalpy changes and entropy changes is given by the following expression, in which delta G symbolizes the change in [ Gibbs ] free energy of a system at constant pressure :
delta H - T.delta S = delta G [ which, verbally reads : The change in enthalpy minus the product of the absolute temperature and the change of entropy is equal to the change of Gibbs free energy.]
The free energy change is a measure of the driving force of a reaction or the tendency of it to proceed spontaneously. When delta G is negative a chemical or physical process occurs. The negative enthalpy change previously described as being important in determining the course of a reaction can be seen to contribute toward making delta G more negative. Similarly, a positive entropy change contributes toward making delta G negative. From the expression it can be seen that delta H is more important at low temperatures and delta S becomes more important at high temperatures.
The power of thermodynamics stems from the potential to be able to calculate whether or not a hypothetical reaction will proceed in a desired manner. Tables of enthalpies and entropies of substances are available, and by arithmetical addition and subtraction the free energy difference between two possible sets of substances [ i.e. a set before, and a set resulting from, the reaction ] can be calculated. If delta G is negative the reaction can proceed spontaneously in the direction desired. However, the difference in free energy does not indicate the velocity of the reaction since the rate is dependent on the activation energy [ i.e. the energy needed to overcome the energy barrier mentioned above ] and not the difference in energy between reactants and products. Therefore, the spontaneous or naturally occurring processes may proceed at very slow rates [ (catalysts can lower the energy barrier, and so speed up the reaction) ] .
The size of the free energy change between reactants and products determines the position of equilibrium.
Derivation of the phase rule
We will now proceed with the derivation of the phase rule, basing ourselves on the expositions in HW-NAT, volume VII, pp.679.
As already stated above, the First Law of thermodynamics can be stated mathematically as follows :
Where dQ is the amount of heat supply,
dE is the increase of interior energy of the system,
dV is the increase of volume, and
p is the pressure.
While the Second Law of thermodynamics can be stated mathematically as :
Where " / " means 'divided by',
dS is the increase of entropy,
T is the absolute temperature, and
DELTA is a positive quantity (in the limiting case : zero).
Entropy (S) is a measure of disorder of the given system.
From these two expressions follows :
Where "T. DELTA" means : absolute temperature times DELTA.
When E and V are constant (thus dE = 0 and dV = 0) we then get :
The entropy change of a system having a constant volume and constant interior energy is accordingly always positive (or zero). So if we have a number of particles inside a closed volume, such that neither from the latter to the exterior, nor from the exterior into the interior, energy changes are taking place, then in chemical or physical changes (transformations) of the system, then the total inner entropy always increases (or, in a limiting case, stays the same, namely in the case of completely reversible processes, if such exist). When that entropy has reached its highest possible value, then, say, in virtue of some virtual change taking place, no increase in entropy can be the result anymore : equilibrium is attained.
For the derivation if the phase rule the entropy is less suitable. For this purpose it is better to begin with the thermodynamic potential, introduced by GIBBS :
As has been said, we assume this potential to be equivalent to the Gibbs free energy.
When we differentiate this equation, i.e. if we want to determine the rate of change of this thermodynamic potential during a transformation, we get :
or, when using equation (3) :
So when the temperature is constant and the pressure is constant (dT = 0 and dp = 0), we have :
where "- T. DELTA" (i.e. minus T. DELTA) is -- because T is always positive (in the case of it being zero, there can be no transformations taking place at all) -- always negative, because, except in the limiting case, T. DELTA is always positive. So if the temperature and pressure are given, then a complex of particles can undergo only such changes that cause the thermodynamic potential to decrease.
A note (of mine) on the relationship between the thermodynamic potential and the Gibbs free energy.
Because the change in enthalpy, delta H, is, according to the above quote from OUELLETTE, the energy difference between initial and final states, we can bring it very close to the rate of change of the interior energy of the system dE. Also delta S is closely related to the rate of change of entropy dS, which brings equation (4b) very close to the equation
(but recall that delta (as used here) refers to a difference, while d refers to a differential), that was discussed in the mentioned quote from OUELLETTE. And this indicates the close relationship between the thermodynamic potential (Z) and the Gibbs free energy (G).
If we, instead of using equation (4a), we use equation (5) -- which was derived from equation (4a) by using equation (3) --, then we get, when T and p (temperature and pressure) are held constant, dZ(T, p) = - T. DELTA, which we got earlier. And in this way we do not have to assume a constant volume, and, moreover, directly obtain an expression which shows that a transformation will only take place when the thermodynamical potential decreases. The same holds, as we already know, for the Gibbs free energy.
(End of note)
Has the thermodynamic potential reached a minimum, then we have equilibrium.
The classification of the different systems is most convenient when based on the number of independent components. One distinguishes one-, two-, three- and multi-component systems, as C = 1, 2, 3, etc. Further one indicates, on the basis of F = 0, 1, 2, etc., the systems as invariant, monovariant, bivariant, etc.
If F = 0, the number of degrees of freedom is zero, and the corresponding equilibrium is invariant. Its graphical expression is a point.
If F = 1, the number of degrees of freedom is one, and the corresponding equilibrium is monovariant. Its graphical expression is a line.
If F = 2, the number of degrees of freedom is two, and the corresponding equilibrium is bivariant. Its graphical expression is a plane.
etc. (See below)
Of the magnitudes, which, apart from concentration, are important in a system, viz., interior energy, entropy, thermodynamic potential, volume, temperature and pressure, only the latter three can be indicated by their absolute values, while of the remaining magnitudes only their changes can be measured, not their absolute values. Therefore, for most cases one only considers the relations between volume, temperature and pressure alongside (in the case of two- and multi-component systems) the concentrations. And often also volume is, in virtue of its lesser importance, not expressed.
One-component systems
In a one-component system, i.e. a system consisting of only one independent component (C = 1), the phase rule is P + F = 3 (P + F = 1 + 2).
If the equilibrium is invariant, i.e. if F = 0, then P = 3, i.e. the number of phases is three.
Every invariant equilibrium, i.e. an equilibrium having no freedom anymore, is characterized by a set of constant values (for temperature, pressure and volume). The point, expressing an invariant equilibrium in a one-component system, contains three phases, and is called the triple point. At the values of temperature, pressure, etc. determining this triple point, three phases can coexist together (in the case of H2O, for example, the vapor phase (steam), the liquid phase (water) and the solid phase (ice).
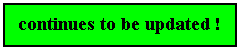
In a diagram, expressing the relationship between temperature and pressure, three curves indicate the stability areas of the different phases, and these three curves meet in a point, the triple point, representing the invariant equilibrium of these three phases. See next Figure.
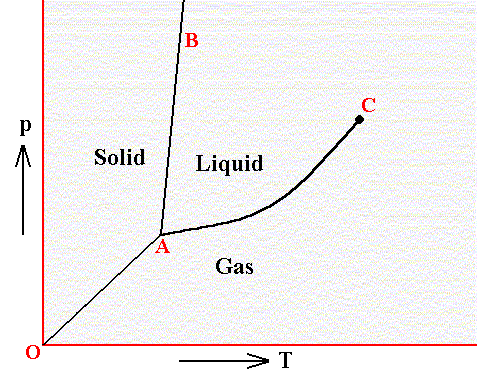
Figure above : Phase diagram of a one-component system (C = 1). It shows the pressure-temperature ( p-T ) borders between the three states (phases) of solid, liquid and gas of a substance. Borders define the conditions of pressure and temperature at which phase transitions such as melting and freezing occur. Point A is the triple point at which all three phases are in equilibrium. At point O the pressure and the absolute temperature are zero.
The border between the liquid area and the gas area stops abruptly at the critical point C, which is unstable. To the right of this point there is no border, which means that in that area there is no distinction between liquid and gas.
The directions of the borders and the extent of the areas depend on the substance involved in the diagram. The solid-liquid boundary (AB) is for most substances steep, and heading NNE, as in the present diagram. Water, on the other hand, is more or less abnormal. For it the solid-liquid boundary runs NNW, as a consequence of the fact that the density of ice is less than that of (liquid) water.
In a diagram expressing the relations between volume and temperature (or volume, temperature and pressure), the invariant equilibrium is represented by a straight line, on which the values of the different volumes lie, where each volume value is the same for the solid, liquid and gaseous state that coexist together at the pT triple point.
Every uniform substance that melts without being broken down, be it a chemical element or compound, possesses a triple point. The position of that point in a pT diagram (i.e. a diagram indicating the relation between pressure (p) and temperature (T), as in the above Figure), says something about the behavior of the substance (or material body) with respect to pressure and temperature.
If the pressure in the triple point of a given substance is higher than the atmospheric pressure (1 Atm), then one can melt this substance only 'under pressure' (which here means a pressure higher than 1 Atm), because only at the triple point pressure the system solid-liquid-gas becomes possible. Examples are arsenic, carbon dioxide and carbon. As a result of heat supply such substances change, at atmospheric pressure, from solid to gas (sublimation), at a specific temperature. This sublimation temperature is lower than that of the triple point and very dependent on pressure. When pressure is increased it eventually goes over into the temperature of the triple point. See next Figure.
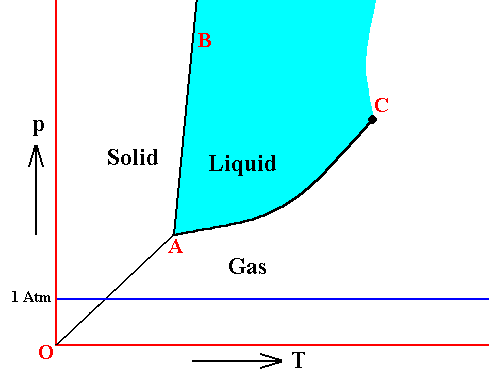
Figure above : Same as previous Figure. Phase diagram of a one-component system (C = 1). Liquid stability area indicated by blue coloring. The substance involved is, in the present Figure, supposed to have its triple point pressure higher than 1 Atm. If the pressure of the system is increased, the sublimation temperature increases, till it is equal to the pressure at the triple point, where the liquid phase becomes possible. When the pressure has increased (not too far) beyond the triple point pressure, then the corresponding substance will pass from the solid state into the liquid state (i.e. it melts), when the temperature reaches a certain value (which is the melting point at that particular pressure).
If for some substance the pressure at the triple point is lower than 1 Atm, then this substance will, when heated, melt at atmospheric pressure at a specific temperature. Also the evaporation of its liquid phase takes place at a specific temperature, when heated. This temperature is the substance's boiling point at atmospheric pressure. See next Figure.
Figure above : Same as previous Figures. Phase diagram of a one-component system (C = 1). Liquid stability area indicated by blue coloring. The substance involved is, in the present Figure, supposed to have its triple point pressure lower than 1 Atm.
m is the melting point of the substance at atmospheric pressure, and b is its boiling point at atmospheric pressure.
The melting temperature at 1 Atm pressure (i.e. when it is in the vicinity of 1 Atm pressure) does not deviate much from the triple-point temperature when the pressure is slightly varied, because the melting curve usually is very steep (AB, in the above Figures), it can, however, be greater or smaller.
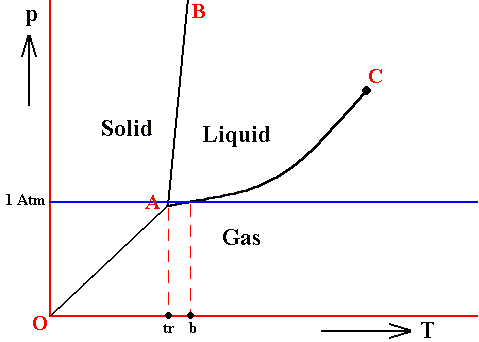
Figure above : Same as previous Figures. Phase diagram of a one-component system (C = 1). The substance involved is, in the present Figure, supposed to have its triple-point pressure close to 1 Atm. A = triple point.
tr is the triple-point temperature, and b is the boiling point of the substance at atmospheric pressure. The lie close to each other.
In such cases, when determining the position of the triple-point by means of experiments working at atmospheric pressure, one is liable to make errors. For example, jodine and camphor apparently can be vaporized at atmospheric pressure, while their triple-point pressure is in reality smaller (91 mm for jodine, 354 mm for camphor, while the atmospheric pressure is 760 mm). In these cases, however, the partial pressure at which the evaporation (sublimation) takes place, is indeed smaller than the triple-point pressure just specified, as a result of the vapor being dissipated quickly enough, and so is smaller than 1 Atm. But because one views the systems jodine and camphor as such, i.e. as they are in themselves, one must consequently consider, not the atmospheric pressure, but the pressure that they (as jodine, and as camphor) actually have, i.e. their partial pressure.
If, in metals, or other materials, with high melting points the triple-point pressure is very low (which implies that there is a large difference between melting point and boiling point), then the temperature at which such substances boil at atmospheric pressure is very high indeed, and can hardly, if at all, be realized with mundane equipment. However, in strongly evacuated containers, where now the pressure is close to the triple-point pressure of these materials, the boiling point has come closer to the melting point (which itself generally varies little with pressure), and indeed in this way one was able to boil these substances.
Until now we have considered the invariant equilibrium (F = 0) in one-component systems.
Qualitative kinetic explanation of vaporization of liquids
When a liquid evaporates below its boiling point it will cool. The next consideration explains this by describing the evaporation in kinetic terms. For this we will quote OUELLETTE, 1970, Introductory chemistry, from page p.64, 65, 67 and 68.
In the liquid phase, as in the gaseous phase, there is a distribution of particles of different kinetic energies [ i.e. energy of motion ] . The most energetic particles leave the liquid phase most readily, causing a decrease in the average kinetic energy of the remaining particles. This is felt as a lowering in the temperature of the liquid. The evaporation process continues at the same rate if a heat source is available to maintain the temperature of the liquid. A glass of water in a closed room [ i.e. in a large but not infinite environment ] without air currents will evaporate without any noticeable cooling. As the most energetic particles leave the liquid phase, heat is transferred from the surroundings to the liquid, maintaining the temperature. A redistribution of particles with various kinetic energies yields the same Maxwell-Boltzmann distribution as existed before the most energetic particles left.When the prevailing pressure of the system decreases, as is the case at high altitudes, the vapor pressure, as it increases with temperature, reaches this (lower) prevailing pressure sooner, resulting in a lower boiling point. When the prevailing pressure is increasing, so does the boiling temperature, as we see in pressure cookers. Indeed, to reach the required vapor pressure, which must be equal to the, now higher, prevailing pressure of the system, takes more heating, because the temperature at which the vapor pressure is equal to the (higher) prevailing pressure of the system is higher than the boiling point belonging to the lower prevailing pressure. See next Figure.
Evaporation of matter from the liquid phase is less likely as the temperature decreases, since the average kinetic energy of the particles and hence their ability to escape into the gaseous phase decreases [...].
Even at the same temperature, different liquids evaporate at different rates [...]. The ease of evaporation in the liquid phase is a function of the liquid. Since the average kinetic energies of particles in two different liquids at the same temperature are identical, the escaping tendency must be controlled by the attractive forces between neighbors. If attractive forces between neighboring particles are large, the escaping ability of a given particle is retarded by its neighbors [...].
Evaporation from an open vessel indicates that the liquid particles have an escaping tendency. This tendency also should be manifested in a closed vessel. However, when a liquid is placed in a closed vessel there is only a small decrease in the volume of the liquid with time. This should not be too unexpected because the densities of matter in the liquid and gaseous phases are drastically different. Evaporation of a small quantity of liquid results in a large volume of gas. Whenever a liquid is placed in a closed vessel, particles leave the liquid phase and enter the gaseous phase. As the number of particles in the gaseous phase increases, it becomes more likely that they will collide with the liquid surface and return to it. Eventually a balance is achieved : The rates at which the particles leave and return to the liquid phase become equal [...]. When such a balance occurs, the system is in equilibrium. In a system at equilibrium no net macroscopic change occurs. Various submicroscopic processes, such as evaporation and condensation, occur continuously, but in such a manner that they balance each other.
The particles in the gas phase exert a pressure like those of any gas. This pressure of a gas in equilibrium with its liquid phase is called the vapor pressure of the liquid [...]. It indicates the escaping tendency of the liquid, which in turn is characteristic of the individual liquid and its temperature [...].
Evaporation as a physical process is rather unspectacular, but upon heating to a specific temperature any liquid eventually will undergo a very pronounced transformation. Bubbles are formed throughout the liquid, and they rise rapidly to the surface, bursting and releasing vapor in large quantities. This process is called boiling, and the temperature at which it occurs is called the boiling point of the liquid. At the boiling point it can be shown experimentally that the vapor pressure of the liquid is equal to that of atmospheric pressure [ generally, equal to the prevailing pressure of the system ] . Owing to the large escaping tendency of the liquid at its boiling point, bubbles of vapor may be formed within the volume of the liquid. This is in contrast to the process of evaporation that is largely a surface phenonenon.
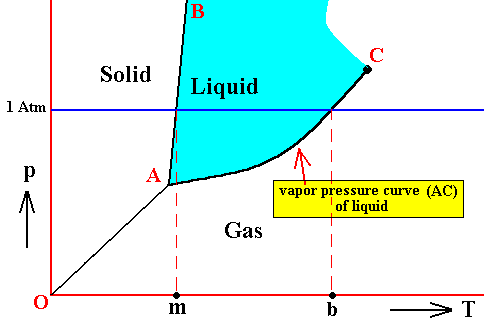
Figure above : Phase diagram of a one-component system (C = 1). The substance involved is, in the present Figure, supposed to have its triple-point pressure lower than 1 Atm.
m is the melting point of the substance at atmospheric pressure, and b is its boiling point at atmospheric pressure.
The curve AC expresses the increase of the vapor pressure of the liquid with increasing temperature. When this vapor pressure reaches the prevailing pressure of the system, the liquid will boil. That the curve AC must be the vapor-pressure curve (for the liquid) follows from the fact that the vapor pressure of a liquid is only defined under equilibrium conditions, i.e. when the liquid is in equilibrium with its gas phase.
So if the prevailing pressure happens to be 1 Atm, then the liquid will boil when its vapor pressure has (because of increasing temperature) become equal to 1 Atm. The corresponding temperature where this happens is the boiling temperature of the substance at 1 Atm.
The vapor pressure of a liquid increases with temperature, because with rising temperature the particles become more energetic and will then more easily escape from the liquid, adding in this way to the vapor pressure.
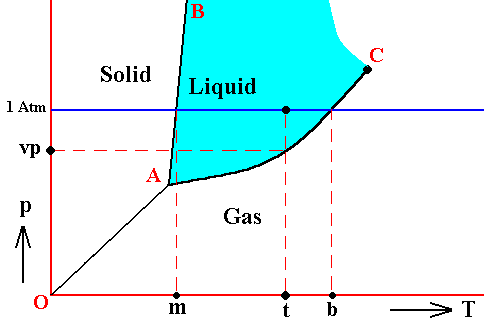
Figure above : Phase diagram of a one-component system (C = 1). The substance involved is, in the present Figure, supposed to have its triple-point pressure lower than 1 Atm.
m is the melting point of the substance at atmospheric pressure, and b is its boiling point at atmospheric pressure.
The curve AC expresses the increase of the vapor pressure of the liquid with increasing temperature. If this substance finds itself under the condition of temperature t and a pressure of 1 Atm, then its vapor pressure is vp.
It is perhaps important to emphasize that the above phase diagrams are about some non-specified substance. Different substances behave according to different phase diagrams. And especially H2O (water) behaves differently. Its melting curve runs NNW instead of NNE. See next Figure.
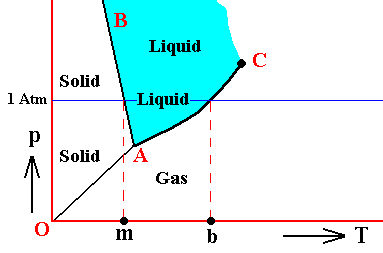
Figure above : (Approximate) Phase diagram of H2O (water) as a one-component system (C = 1). The phases are Ice, Water and Water vapor. A = triple point, AB = melting curve, AC = vapor-pressure curve of liquid water, OA = vapor pressure curve of solid water (ice), C = critical point, m = melting point (2730K = 00C) at 1 Atm, b = boiling point (3730K = 1000C) at 1 Atm.
The phase diagram of water is subtly different from that of most substances. The solid-liquid boundary slopes NNW, not NNE. This is a direct consequence of the fact that water has the unusual property of getting less dense when it freezes. The triple-point pressure of H2O is 4.6 mm mercury, and its triple-point temperature is 0.0070C (See also BALL, Ph., H2O, a Biography of Water, 1999, 2000, p.150).
Also solids have vapor pressure.
Solids, like liquids, have a vapor pressure. However, the idea that a solid can evaporate is not as common among the nonscientific community as the concept of evaporation of liquids. The evaporation of ice is the reason that even frozen clothes will dry outdours in subzero weather. The vaporization of solid carbon dioxide (Dry Ice) and mothballs are other common examples.
The kinetic theory applies to solids in much the same way as to liquids. Particles in the solid state [ i.e. in the context of a (macroscopic) solid ] have a range of energies and are distributed among the energies according to the Boltzmann curve. Those of the more energetic particles that lie at the surface of the solid can escape into the gas phase. This is in contrast to the liquid state, in which the mobility of the particles may result in the transfer of a particle from deep within the liquid to the surface where it may escape.
The vapor pressure of a solid can be measured by the same apparatus [ as in the case ] [...] of the vapor pressure of a liquid [...]. As is the case with liquids, the vapor pressure is a measure of an equilibrium process. If a solid such as ice is placed in a closed container, the most energetic surface particles escape. However, eventually the gaseous particles return to the solid. The pressure of the vapor gradually increases to a maximum value. Then, the rate of escape is equal to the rate of return to the solid.
The larger the attractive forces between molecules or atoms, the smaller will be the vapor pressure of the solid. With increasing temperature the vapor pressure of the solid increases, because the average kinetic energy of the particles increases. However, the vapor pressure of most solids rarely gets very large since the solid usually melts at high temperatures. For most solids the tendency to enter the liquid phase is larger than that for entering the gaseous phase. Dry Ice, solid carbon dioxide, is an exception in that upon heating it is converted directly to the gaseous state. The liquid state [ of carbon dioxide ] is not observed at atmospheric pressure. Direct vaporization of a solid without melting is called sublimation.
In order to qualitatively predict change in phases caused by an external factor, we can use Le Châtelier's Principle.
Le Châtelier in 1884 proposed a principle that predicts the behavior of an equilibrium when it is subjected to an external force : If an external force is applied to a system at equilibrium, the system will readjust to reduce the stress imposed upon it if possible. This principle, which is intuitively reasonable, explains the effect of pressure on the boiling point of a liquid and the melting point of a solid. In the first case, evaporation of a liquid always involves a tremendous increase in volume. Application of pressure will cause the equilibrium system of a liquid and its vapor at its normal boiling point to shift toward the liquid state, because the resultant decrease in volume tends to diminish the pressure on the equilibrium system. Therefore, in order to boil a liquid at high pressures, higher temperatures are necessary. In the case of the melting point of a solid, most substances decrease in volume in going from the liquid to the solid state, and application of pressure will cause an equilibrium system of liquid and solid to shift toward the solid state. This shift decreases the volume of the system and counteracts the applied pressure. Therefore, in order to melt most solids under pressure, higher temperatures are necessary. That only small increases in melting points are usually observed is a reflection of the small change in volume between solids and liquids. The abnormal behavior of water is the result of the increase in volume of this compound in going from water to ice. Thus, an increase in pressure shifts ice-water systems toward water.We can now, using the concept of vapor pressure, characterize the triple point in a more detailed way, using H2O (water) as an example.
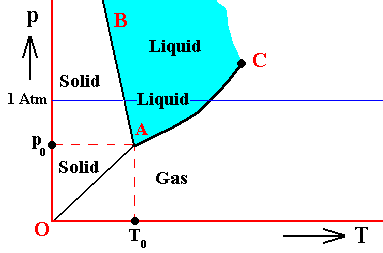
Figure above : (Approximate) Phase diagram of H2O (water) as a one-component system (C = 1). The phases are Ice, Water and Water vapor. A = triple point.
If the condition (state) of the H2O system is T0p0 , i.e. if the temperature of this system is T0 and the pressure p0 , then the vapor pressure of the solid is equal to that of the liquid. So the solid is not forced to either increase or decrease the vapor pressure in order to achieve a balance with the liquid. And so for the liquid. But because there now is no net inflow or outflow of vapor into and from solid or liquid, the vapor phase is static too. So all three phases are in equilibrium (i.e. they can all coexist at the same time) when the state of the system is T0p0 . Therefore, the point (T0, p0) is called the triple point of the system. The triple-point pressure of water (p0) is 4.6 mm mercury, and its triple-point temperature (T0) is 0.0070C ( = 2730K ).
Having considered the triple point as being an invariant equilibrium (i.e. where the number of degrees of freedom is zero, F = 0) and as implying -- according to the phase rule (P + F = C + 2), for one-component systems (C = 1) -- three phases (F = 3), and having, in addition, considered some important concepts -- we are now ready to discuss the monovariant equilibria and the bivariant equilibria that, in addition to the triple point itself, figure in every triple-point diagram :
If --- things are taken here from HW-NAT (Handwörterbuch der Naturwissenschaften, 1912--1915), VII, p.680 --- there are monovariant equilibria in one-component systems, i.e. when F = 1, then P = 2 (i.e. the number of phases is two). In the presence of two phases we still have one freedom, i.e. within the range in which equilibrium between the relevant two phases is possible at all, one can, among the determining factors (for instance pressure, temperature, volume, etc.), still choose a value of one of them as one pleases, and not until then all magnitudes relating to the equilibrium are fixed. One such monovariant equilibrium is the curve that leads from zero pressure and zero temperature (the point O in our phase diagrams) to the triple point (A). It is the sublimation curve, OA, on which lie all the points (temperature-pressure coordinates) in which the solid state (phase) is in equilibrium with the gaseous state (phase). It is at the same time the vapor-pressure curve of the solid.
A second monovariant equilibrium exists between solid and liquid. This melting curve runs from the triple point generally steeply upwards (AB in our phase diagrams), resulting in only a small deviation of the melting point at the triple point (for example ice, 0.0070C) from that at atmospheric pressure (00C). The deviation, positive or negative, depends on the volume taken up by the given substance in its solid or liquid state. If the volume of the solid state is larger than that of the liquid state (as, for instance in the ice-water system), then the melting temperature decreases with increasing pressure (as is evident from Lechâtelier's princple mentioned above). In many other substances, on the other hand, the melting temperature increases with pressure : in the solid state the volume is smaller than in the liquid state, which means that at solidification the solid parts sink to the bottom of the melt (while in water this is the other way around, so that ice-bergs float on the water). At each point of this curve the solid phase is in equilibrium with the liquid phase.
Finally, the third monovariant equilibrium -- liquid-gas -- in one-component systems, is the boiling curve or vapor-pressure curve of the liquid, running from the triple point in about a NE direction in the phase diagram (AC). It ends in the critical point C. At each point on this curve the liquid phase is in equilibrium with the gaseous phase.
Bivariant or divariant equilibria (F = 2) in a one-component system, exist, according to the phase rule (P + F = C + 2), at the presence of only one phase (P = 1). As a result of this dual variability, the phases viz., solid, liquid, gaseous (and supercritical), are, in the phase diagram, depicted as plane areas, bounded by the curves representing the monovariant equilibria.
In what follows we will try to interpret the behavior of one-component systems, and especially the ice-water-steam system, in terms of the triple-point diagram (phase diagram, stability diagram) of the given substance. This turns out to be no easy matter, caused by the fact that we must distinguish between pure systems on the one hand, and those that are embedded in a broader inert matrix, on the other (for example, respectively, the ice-water-steam system as a system that contains only H2O and nothing else, and the ice-water-steam system as embedded in, say, air (as it is in the atmosphere)).
The concept of a bivariant equilibrium is a strange one at first sight. An equilibrium implies two entities that balance each other. But in a bivariant equilibrium of a one-component system only one phase can be present. So this phase must be in equilibrium with itself. This is, without qualification, possible for a gas, for example water vapor under a pressure of 1 Atm and having a temperature of 1200C (or any other temperature moderately above water's normal boiling point). But solids and liquids always give off vapor and thus, when there is equilibrium, it is always equilibrium with their corresponding gas phase : The rate of particles leaving the solid or the liquid is equal to the rate of particles returning to them, and thus two phases are involved in the equilibrium. So when, if ever, will we see an equilibrium that involves only one phase? Well, according to me, we must think of the interior of a given solid or of a given liquid, when such a solid or liquid finds itself in pressure-temperature (P/T) conditions corresponding to the 'solid' or 'liquid' area of the triple-point diagram. So if we have a mass of solid, or a mass of liquid under the mentioned P/T conditions, then any volume within its interior (i.e. any volume that does not include any interface -- or 'interphase') is in equilibrium with itself.
For a solid to be in equilibrium with itself, this is directly clear, because its constituents do not wander around. So for any volume totally within its interface boundaries, the rate of incoming particles is equal to the rate of outcoming particles, namely zero.
For a liquid to be in equilibrium with itself, we can say that the traffic into and the traffic out of such an interior volume balance each other.
And indeed the same can be said of any interior volume of a given gas. When the gas is in equilibrium with itself, there is a balance between the traffics into and out of such an interior volume representing the gas.
If given substances are held in pressure-temperature conditions which do not correspond to their aggregation condition (solid, liquid, gas), for example liquid water held below 00C (at atmospheric pressure) -- a phenomenon called undercooling -- then they find themselves in an unstable condition and the stable equilibrium is often quickly restored when seeded or shaken. The next Figures illustrate this. In doing so, they consider one-component thermodynamic systems in general, using the ice-water-steam system as an example. So in this context the latter system must be seen as it is in itself, and not as contained within an overall matrix as is the case in our atmosphere (which situation will be discussed further below). If, in relevant examples, we nevertheless suppose the system to be mixed up with air (not necessarily resulting in a total pressure of 1 Atm, as it does in the atmosphere), we will say so.
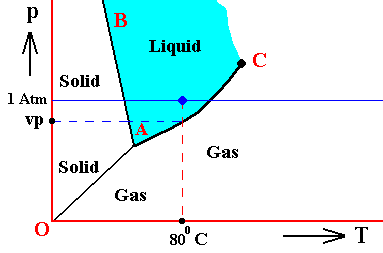
Figure above : (Approximate) Phase diagram of H2O (water) as a one-component system (C = 1). The phases are Ice, Water and Water vapor. A = triple point. Blue area signifies the stability area of the liquid phase.
If (as an example) some quantity of H2O finds itself at a temperature of 800C (or any other temperature between 00 and 1000) and under a pressure of 1 Atm, and, at the same time, finds itself in the liquid state, then it is as such stable. The liquid will neither boil nor freeze. We have to do with a bivariant equilibrium (F = 2), and, as we have found out above, this holds for any interior volume of that given liquid. In the graph we can see that the vapor pressure (vp) of liquid water at 800C (which is a property of H2O) is lower than 1 Atm (which is the pressure under which the system -- in this particular case -- is supposed to be). And if the system consists of H2O only, then the actual pressure of the water vapor above the water has a pressure of 1 Atm, so a part of this water vapor will condense until the pressure has decreased from 1 Atm to vp . The system has then arrived at the water-vapor curve of liquid water (at 800C) and finds itself in a monovariant equilibrium (between liquid and gas).
If the system of H2O is contained within a matrix of air (supplementing the vp pressure to 1 Atm), then the equilibrium water-vapor pressure at 800C, which is (always) vp , is lower than the pressure (1 Atm) of the system, meaning that the water will not boil. We can see that, although the actual water-vapor pressure (as partial pressure) is equal to the equilibrium vapor pressure vp (at 800C), and in this way suggesting the presence of a monovariant equilibrium between liquid and gas, the extra pressure of the air, resulting in 1 Atm pressure under which the system stands, presses the system, from the vapor-pressure curve, up into the 'liquid' area of the triple-point diagram. We must note that if the system of H2O as embedded in air is to be in equilibrium, the water vapor must be prevented from diffusing away from the system, otherwise all the liquid will eventually be evaporated. The system must therefore be contained in a closed vessel. But then a pressure will result that is a little above 1 Atm. We can understand this as follows : If we have a vessel partially filled with liquid water, and open to the atmosphere, the actual vapor pressure will remain below the equilibrium vapor pressure of liquid water at the given temperature, thanks to the diffusing away of the water vapor into the atmosphere. Therefore all the water will eventually evaporate. To prevent this we close the vessel. The pressure of the vapor is now allowed to increase (thanks to evaporation from the liquid) until it has become equal to the equilibrium vapor pressure (of liquid water at the given temperature). It is then that we have equilibrium between the liquid and its gas. But the vapor that has in this way been added to the air above the liquid (but still in the closed vessel) increases the overall pressure, resulting in a pressure a little above 1 Atm. This can easily be such that the system still resides within the 'liquid' area of the triple-point diagram.
If, on the other hand, when still existing under the same temperature-pressure conditions (800C and 1 Atm), this same quantity of H2O finds itself in the gaseous state, then it is unstable (it is undercooled vapor), and directly condenses into liquid as soon as it receives an appropriate nudge (for example the presence of dust particles that represent suitable condensation nuclei ). Also in this case, when the system is pure H2O, the initial gas (which is 100 percent water vapor) condenses until it will be in equilibrium with the resulting liquid, entailing in this way a decrease in pressure from 1 Atm to the equilibrium vapor pressure of liquid water at the given temperature (800C), which pressure is given as vp in the above Figure. In this way a monovariant equilibrium is established between water and water vapor. A bivariant equilibrium can be established when the decrease in pressure is compensated for by air, that is to say when the H2O system is not considered to be a pure system, but embedded within air. Also here the vessel must be closed, resulting in an overall pressure a little above 1 Atm, which can be such that the system still resides in the 'liquid' area of the triple point diagram, and so is in equilibrium with itself, which is a bivariant equilibrium.
And also when our quantity of H2O finds itself in the solid state (when still existing under the same temperature-pressure conditions (800C and 1 Atm)), it is unstable, and directly melts, i.e. transforms spontaneously into a liquid.
It is important to realize that because we here (i.e. in the present example) first of all treat the ice-water-steam system as it is in itself, the pressure of 1 Atm under which the system is supposed to be, has no special significance, it has been choosen arbitrarily.
When we speak of the " vapor pressure of a liquid at a temperature T " without further qualification, we mean the vapor pressure that is measured when the liquid is in equilibrium with its gas phase at temperature T. This vapor pressure increases with temperature.
The next Figure indicates the above described pressure adjustment of the (pure) system to the equilibrium pressure, for the case that the quantity of H2O initially finds itself in the gaseous state while under temperature-pressure conditions of 800C and 1 Atm, i.e. where we have to do with an undercooled vapor. If the system is not embedded in air, i.e. if the H2O system is pure, we have water vapor having a pressure of 1 Atm. This is well above the equilibrium vapor-pressure of liquid water at 800C, so this vapor will (under appropriate nucleation conditions) start to condense until equilibrium is reached between the liquid and the gas phase (as described above). This is a monovariant equilibrium (F = 1). So it is evident that during condensation water vapor is consumed by the forming liquid, implying that the pressure is decreasing. This pressure will keep on decreasing until it reaches the equilibrium pressure (vp) at 800C. In all this we must imagine that we start with a rigid container of volume V containing only water vapor. The vapor is supposed to have a temperature of 800C, and there is so much of it in the container that its pressure is initially 1 Atm. As the vapor partially condenses the temperature of the system remains constant at 800C, but the pressure decreases.
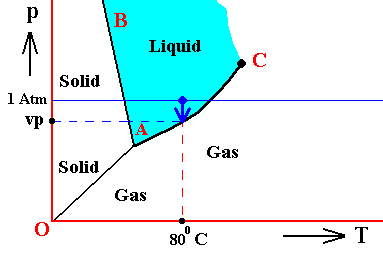
Figure above : (Approximate) Phase diagram of H2O (water) as a one-component system (C = 1). The phases are Ice, Water and Water vapor. A = triple point. Blue area signifies the stability area of the liquid phase. Initial pressure of the system is 1 Atm.
Pressure adjustment.
As the water vapor condenses while the temperature remains constant, its pressure decreases until it reaches vp , which is the equilibrium pressure for 800C. This pressure reduction is indicated by the arrow.
In the above Figure we ended up with our substance H2O consisting of two phases, liquid water and water vapor. The pressure was vp and the temperature was 800C. But because this actually prevailing pressure is equal to the equilibrium vapor pressure of liquid water at this temperature, the system is in fact at the boiling point of water corresponding to the pressure vp. But will then not that water boil? No, it will not, because for it to actually boil, energy is required. Let us cite OUELLETTE, R., Introductory Chemistry, 1970, p.69-70 :
The average kinetic energies of particles in gaseous and liquid phases at the boiling point are equal. However, energy is required in order to maintain boiling with the resultant transfer of matter from the liquid to the gaseous phase. The heat added does not increase the temperature of the liquid at the boiling point but provides the energy necessary for the most energetic particles to continue to escape [ Recall that when a liquid is evaporating, the most energetic particles escape, resulting in the average kinetic energy of the liquid to decrease. So it becomes more and more difficult for the (slower) particles to escape. Consequently, to keep the evaporation process going, energy must be supplied. ] . The quantity of heat energy required to transform 1g of a substance at its boiling point from a liquid into a gas is called its heat of vaporization. The heat of vaporization of water is 540 cal/g, a value that is rather large compared to other liquids. Its size is a reflection of the strong attractive forces between neighboring water molecules in the liquid phase.(End of quote)
While the heats of vaporization of substances are usually listed in calories per gram, it should be pointed out again that mass per se is not of primary importance in understanding matter. The number of atoms [ or molecules ] involved in a phenomenon is more basic [ So the heat of vaporization is better expressed in terms of calories per mole of compound, where a "mole" is the number of grams equal to the molecular weight of the compound, and where in turn the "molecular weight" is the number of times that one molecule of the compound is heavier than 1/12 of an atom of a certain isotope of carbon, or, more roughly, is heavier than one hydrogen atom. ] [...] . If the heat of vaporization per mole of a substance is divided by its boiling point on the Kelvin scale, an average value of 21 cal/mole-deg [ i.e. calories-per-mole per degree Kelvin ] is obtained for many liquids.
The empirical observation that for most liquids the quotient of the molar heat of vaporization and the boiling point is nearly always 21 cal/mole-deg is called Trouton's rule. Why this ratio is constant is an intriguing question. At the boiling point, the relatively unified liquid phase is transformed into a random gaseous phase with no change in the average kinetic energy of particles. However, energy has been required for the process and has been utilized in randomizing the system. At the boiling point vapors can be liquefied with the recovery of energy equal to the heat of vaporization. In the liquefaction process matter becomes less random and more ordered. The constant value of 21 cal/mole-deg indicates the constant relation between heat energy and temperature for the randomization process.
The term entropy (S) is used to indicate the degree of randomness of a system. As the molecular chaos of matter increases, its entropy is said to increase. The entropy of matter in the liquid phase is less than that in the gaseous phase, and the value 21 cal/mole-deg is a measure of the change in entropy (DELTA S) for the transformation. Thus, for the general process of converting matter from the liquid to the gaseous phase, the increase in the randomness of the system is a constant.
In the case of water and alcohol, the Trouton's constant is approximately 26 cal/mole-deg, a higher-than-average value. Since the value represents a change in entropy for the process of vaporization, it must be concluded that there is something about the molecular structure of these compounds that leads to higher than average ordering in the liquid state [ because the 'distance' on the scale of degrees of order from the gas state to the liquid state of each of these compounds (water and alcohol) is greater than that in many other compounds, while the degree of order of gases of different substances at the same temperatures is supposed to be the same. So having to traverse a longer distance along the scale of lowest-degree order (randomness) - higher-degree order, than is the case in other substances, lets us end up with a higher degree of order of the liquid in water and in alcohol than in that of other substances. ]. If this is the case, then the change in the degree of molecular chaos would be larger for the vaporization process that leads to the very random gaseous state [ And indeed, in an earlier document, we have seen that liquid water does have some structure ].
So to have a substance at its boiling point corresponding to the prevailing pressure, is not enough to get it boiling. Energy must be supplied for randomizing the system.
While in the above examples we had to do with a temperature of 800C, the next example involves a different temperature.
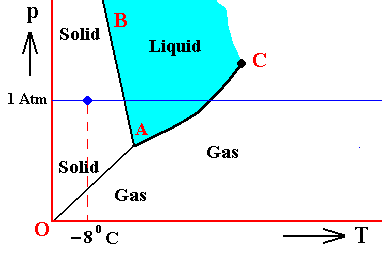
Figure above : (Approximate) Phase diagram of H2O (water) as a one-component system (C = 1). The phases are Ice, Water and Water vapor. A = triple point. Blue area signifies the stability area of the liquid phase.
If (as an example) some quantity of H2O finds itself at a temperature of -80C (or any other temperature (moderately) below its normal freezing point) and under a pressure of 1 Atm, and, at the same time, finds itself in the solid state, then it is as such stable.
The ice will neither melt nor sublimate. We have to do with a bivariant equilibrium (F = 2). Also in this case we consider an interior volume of this ice. Such a volume is under the mentioned temperature-pressure conditions (-80C, 1 Atm) in equilibrium with itself.
If, on the other hand, when still existing under the same temperature-pressure conditions (-80C and 1 Atm), it finds itself in the liquid state (which we call undercooled water), then it is unstable, and directly freezes as soon as it receives an appropriate nudge (for example when an ice fragment is added). The resulting ice is then in equilibrium with itself (bivariant equilibrium) when only considering its interior (i.e. any interior volume of it).
And, finally, when it finds itself in the gaseous state (when still existing under the same temperature-pressure conditions (-80C and 1 Atm)), it also is unstable, and transforms into the solid state, as soon as it receives the appropriate nudge. It is to be expected that in this case we first see a transformation into the liquid state, and then -- when conditions for ice nuleation are satisfied (for example the presence of ice, or the presence of dust particles such as providing a template for the ice structure to be formed) -- a transformation into the solid state. This solid phase (ice) is in equilibrium with itself when considering only its interior.
In the above we considered the bivariant equilibrium of the solid, i.e. the solid (ice) resulting from the nucleation of the undercooled liquid. In its interior it is in equilibrium with itself. But, at its periphery vapor (the pressure of which was initially 1 Atm) is being precipitated onto the solid, until the pressure of this vapor has become equal to the equilibrium vapor-pressure of ice at -80C, which is a monovariant equilibrium. This is discussed in the next Figure which indicates the pressure readjustment of the system in the case of the quantity of H2O, initially finding itself (as just discussed) in the liquid phase at a temperature-pressure condition of -80C and 1 Atm, and now transforming itself into the solid phase. This freezing will go on until equilibrium is reached between ice and water vapor, resulting in a pressure vps of the system. This is a monovariant equilibrium (F = 1).
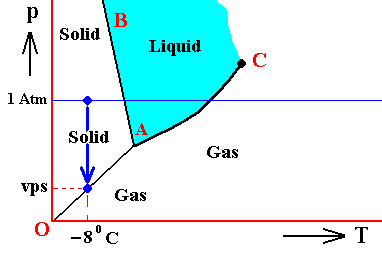
Figure above : (Approximate) Phase diagram of H2O (water) as a one-component system (C = 1). The phases are Ice, Water and Water vapor. A = triple point. Blue area signifies the stability area of the liquid phase. Initial pressure of the system is 1 Atm.
Pressure readjustment.
As the liquid water freezes (while the temperature does not change), the pressure of the system decreases until it reaches vps , which is the equilibrium pressure for -80C (i.e. the pressure has become equal to the equilibrium water-vapor pressure of ice at a temperature -80C). This pressure reduction is indicated by the arrow.
Here we must imagine having a semi-rigid container partially filled which liquid water having a temperature of -80C. The pressure of the water vapor above the water (which is in the present case the pressure of the system) is supposed to be 1 Atm. Part of this water freezes, until equilibrium is achieved. We assume that in the present case our container changes its volume just enough as to compensate for the volume increase of the ice with respect to the liquid. While the temperature being constant, the pressure will reduce to vps. Because the temperature is not that of the triple point, maximally only two phases can coexist at an equilibrium, as is visible in the diagram at -80C. And because of the supposed volume adjustment of the container, the pressure change can only be negative, and in this way we arrive at the solid-gas boundary, implying the solid and the gas states to be in equilibrium (and not the solid and the liquid state). But because, the system now stands under a pressure equal to the equilibrium pressure of ice at -80C (a pressure -- exerted by the water vapor -- that propagates through the whole solid), the system is in its entirety positioned on the vapor-pressure curve of ice, implying that there is no bivariant equilibrium anymore. The system as a whole is in a state of monovariant equilibrium between solid and gas.
I again emphasize, that in the above examples we have been talking about the ice-water-steam system as it is in itself, as a system of phases. In the case of the formation of snow, water droplets, etc., in the earth's atmosphere, some additional features pop up, like under-saturation, saturation and super-saturation of water vapor in the air. Also this will be discussed below.
Just above we had described that, as a result of the precipitation of water vapor onto the ice, the pressure -- of the water vapor and, by implication, of the system (which consists of H2O only) -- will decrease, until a monovariant equilibrium is established between vapor and ice. In what cases then, will we have a bivariant equilibrium? Well the latter could be established if the decrease of the pressure of the water vapor (as being originally the pressure of the pure H2O system) is neutralized by that of another gas or mixture of gas, say, air. Only then the above described system will remain at the pressure of 1 Atm, implying that it is, and remains, positioned within the 'solid' area of the triple-point diagram. And then we indeed have to do with a bivariant equilibrium as described above. In fact the pressure of the system will end up a little above 1 Atm (but with this it is still possible that the system resides in the 'solid' area of the triple-point diagram). This is because when we want to maintain equilibrium between the solid and the gas, the container must be closed : if it is open, then the water vapor that comes from the ice will diffuse into the broader environment, preventing in this way the establishing of the equilibrium. Eventually the whole solid will evaporate (just as it is in the case of liquids). So the container must be closed. But then the pressure will rise a little above 1 Atm, the excess being exactly the equilibrium vapor pressure of ice at the temperature of the experiment (which was -80C).
Also it is important to know that during a phase transition the temperature remains constant :
When a solid is heated, the supplied heat (which is coming from the environment of the system) increases the average kinetic energy of the constituent particles of the solid, which means that the temperature of this solid rises. When, finally, the melting point has been reached, the heat, that is still being supplied, is used to partially randomize the system. The system goes from an orderly state to a moderately disordered state. Only after the solid has been totally molten, the temperature will rise again.
This heat -- the heat of fusion -- consumed at the melting point, will be recovered when the liquid is set to freeze (crystallize) again : heat of crystallization : During crystallization from the melt this heat is returned to the environment of the system : also here the temperature of the system remains constant (melting point).
The same is the case fo the other phase transition :
When a liquid is heated, the supplied heat (which is coming from the environment of the system) increases the average kinetic energy of the constituent particles of the liquid, which means that the temperature of this liquid rises. When, finally, the boiling point has been reached, the heat, that is still being supplied, is used to fully randomize the system. The system goes from a moderately disordered state to a totally disordered state. Only after the liquid has been totally transformed into vapor, the temperature will rise again.
This heat -- the heat of vaporization -- consumed at the boiling point, will be recovered when the vapor is set to condense again : heat of condensation : During condensation of the vapor this heat is returned to the environment of the system (as it happens in the cooler of a distillation device) : also here the temperature of the system remains constant (boiling point).
While in the above two cases, apart from the system's spontaneous readjustment to equilibrium pressure, the temperature-pressure conditions were supposed to remain constant, which means that, while describing some phase transition that takes place, we do not move over the diagram (i.e. we do not actively change the specified temperature-pressure coordinates), in the next case we actively change a condition to the effect that we change one of the temperature-pressure coordinates, which means that, in the diagram, we change position, we move over the diagram, and so can enter from one phase into another.
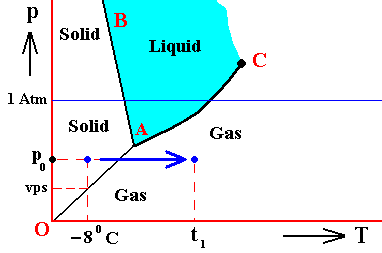
Figure above : (Approximate) Phase diagram of H2O (water) as a one-component system (C = 1). The phases are Ice, Water and Water vapor. A = triple point. Blue area signifies the stability area of the liquid phase.
If (as an example) some quantity of H2O finds itself at a temperature of -80C (or any other temperature below its normal freezing point) and under a pressure of p0 Atm (i.e. some pressure, lower than 1 Atm, and also lower than the triple-point pressure), and, at the same time, finds itself in the solid state, then it is as such stable. If we now raise the temperature from -80C to t10 (i.e. a temperature above the triple-point temperature), then the ice will evaporate, i.e. the solid phase transforms into the gaseous phase. In the diagram this is expressed by a movement indicated by the arrow.
Let us describe more precisely the initial condition of this experiment (ice under a pressure of p0 Atm and having a temperature of -80C).
In the present experiment we had set the pressure of the system at p0 Atm (wich is lower than 1 Atm, and, what is especially relevant, it is lower than the triple-point pressure of H2O). But as we can see in the diagram, the equilibrium vapor-pressure of ice at -80C (vps) is lower than p0 . So in order to have the system in equilibrium, we must now see the mentioned equilibrium vapor pressure vps (of ice at -80C) as being a p a r t i a l pressure. The remaining part of the pressure is taken to be caused by a i r that is now supposed to be present in the system (making a total pressure of p0 ). That the partial pressure, exerted by the water vapor is vps, means that when the air were taken away, without changing the volume of the system, the water vapor would exert a pressure of vps.
If the equality between the actual prevailing vapor pressure and the equilibrium vapor pressure of ice (at -80C) is to be maintained, the vessel (containing the ice, water vapor and air) must be closed.
The significance of the fact that the actual prevailing pressure of the water vapor (in the vessel) is equal to the equilibrium vapor-pressure of ice at that temperature, is that it guarantees that the traffic of water vapor to the ice (i.e. the precipitation of water vapor onto the ice) exactly balances the traffic of water molecules out of the ice, resulting in a constant net amount of ice.
The system itself -- as it is in its initial state -- stands under a pressure (p0) that is higher than the equilibrium vapor pressure of ice at the given temperature (vps), which means that the position of the system is above the equilibrium vapor pressure curve of ice (sublimation curve), which in turn means that the system entirely resides in the 'solid' area of the triple point diagram, in this way representing a bivariant equilibrium.
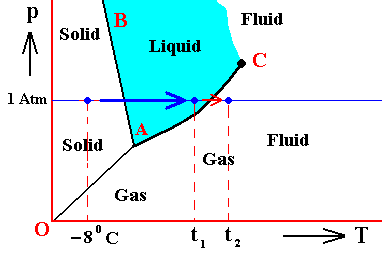
Figure above : (Approximate) Phase diagram of H2O (water) as a one-component system (C = 1). The phases are Ice, Water and Water vapor. A = triple point. Blue area signifies the stability area of the liquid phase.
If (as an example) some quantity of H2O finds itself at a temperature of -80C (or any other temperature below its normal freezing point) and under a pressure of 1 Atm, and, at the same time, finds itself in the solid state, then it is as such stable. Also here we assume air to be present in the system, its partial pressure supplementing the equilibrium water-vapor pressure of ice at -80C (which is lower than 1 Atm) to a pressure of 1 Atm.
If we now raise the temperature from -80C to t10 (i.e. a temperature above the triple-point temperature, but below the boiling point at 1 Atm), then the ice will melt, i.e. the solid phase transforms into the liquid phase. In the diagram this is expressed by a movement indicated by the blue arrow.
If we then continue to raise the temperature (from t1) to t2 , i.e. to a temperature lying above the boiling point at 1 Atm (but below the critical temperature), then the liquid will transform into the gaseous phase. This is indicated by the red arrow. If the temperature is raised still further, eventually the supra-critical area will be reached, where there is no difference anymore between the liquid and the gaseous states. This super-critical phase is called fluid.
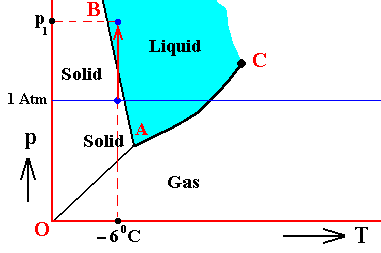
Figure above : (Approximate) Phase diagram of H2O (water) as a one-component system (C = 1). The phases are Ice, Water and Water vapor. A = triple point. Blue area signifies the stability area of the liquid phase.
If (as an example) some quantity of H2O finds itself at a temperature of -60C (or any other temperature below its normal freezing point) and under a pressure of 1 Atm, and, at the same time, finds itself in the solid state, then it is as such stable. If we now raise the pressure (while holding the temperature constant) (from 1 Atm) to p1 (i.e. a pressure well above 1 Atm), then the ice will melt (because now going toward a smaller volume, relieves the pressure on the system), i.e. the solid state transforms into the liquid state. This transition is indicated by a red arrow.
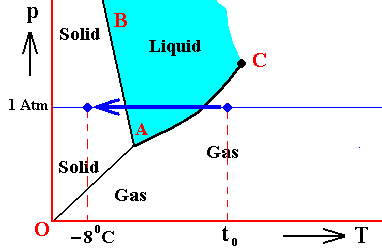
Figure above : (Approximate) Phase diagram of H2O (water) as a one-component system (C = 1). The phases are Ice, Water and Water vapor. A = triple point. Blue area signifies the stability area of the liquid phase.
The Figure illustrates the generation of ice from hot water vapor.
If some quantity of H2O finds itself at a temperature of t00C (meaning a temperature well above its normal boiling point), and at a pressure of 1 Atm, and, at the same time finds itself in the gaseous state, then it is as such stable. If we now rapidly cool the system all the way down to -80C (or any other temperature below the normal freezing point of water), then the gaseous state will become unstable, because the system has moved into the solid area of the diagram. It will change to the solid state, but, generally, not until nucleation events produce crystal embryos of sufficiently large size. It is to be expected that this transition goes through an intermediate state, the liquid state, as it happens in the formation of snowflakes from (cold) water vapor. If the pressure of the system were below the triple point pressure, then the vapor immediately transforms into ice without going through any intermediate phase.
The next Figure gives the phase diagram for H2O (water), taken from the website of K. LIBBRECHT :
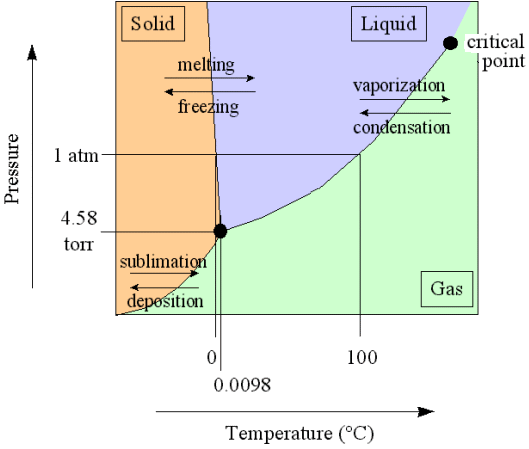
Phase diagram of H2O (water), after LIBBRECHT, www.snowcrystals.com.
According to LIBBRECHT the triple point pressure of water is 6.1 mbar, and the triple point temperature is 0.00980C. (1 mbar = 0.75 mm mercury = 0.001 Atm) (1 mm mercury = 1 torr).
For water-vapor pressure after LIBBRECHT, www.snowcrystals.com click HERE .
The water-vapor pressure under the above LINK represents :
For water vapor supersaturation after LIBBRECHT, www.snowcrystals.com click HERE .
In the following we will t r y to give an account of snow crystals (because of their morphological importance) in terms of the triple point diagram of water. Recall that I am not an expert on these (thermodynamic) matters, so maybe the reader can improve upon it (and send me an e-mail). So what comes is a scenario that leads from water vapor in the air to snowflakes.
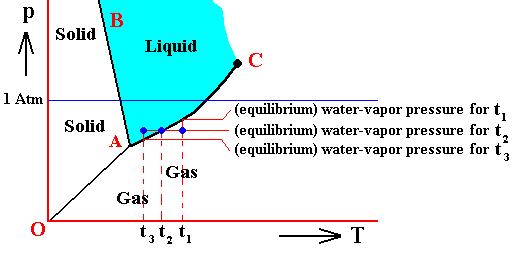
Figure above : (Approximate) Phase diagram of H2O (water) as a one-component system (C = 1). The phases are Ice, Water and Water vapor. A = triple point. Blue area signifies the stability area of the liquid phase.
The Figure describes the first stage in the formation of snow, namely air that becomes supersaturated with water vapor. Water-vapor pressures are indicated by horizontal lines (levels).
The actually prevailing water-vapor pressure, happens -- as is supposed for the present case -- to be equal to the equilibrium water-vapor pressure (of liquid water) belonging to temperature t2 .
The equilibrium water-vapor pressure (of liquid water) at temperature t1 is indicated. It is higher than the actually prevailing water-vapor pressure, and consequently, higher than the equilibrium water-vapor pressure at temperature t2 .
The equilibrium water-vapor pressure (of liquid water) at temperature t3 is indicated. It is lower than the actually prevailing water-vapor pressure (and consequently, lower than the equilibrium water-vapor pressure at temperature t2 as well as that of t1 ). And just because of this equilibrium water-vapor pressure belonging to t3 being lower than the actually prevailing water-vapor pressure (and the latter thus being higher), the air is supersaturated with water vapor.
In the Figure all this is happening if we go from temperature t1 , via t2 to temperature t3 . In this way we have arrived, from the gas area of the diagram into its liquid area, and because (initially) we still have to do with (water) vapor, the system has become unstable. The water vapor will spontaneously turn into water droplets as soon as appropriate condensation nuclei are present.
The next stage in the formation of snow crystals in the atmosphere consists in supposing a further cooling of the water droplets, a cooling up to well below freezing temperature. In the absence of nuclei, water droplets will still not readily freeze. We then have droplets of undercooled water, representing as such an unstable system (because, upon cooling we have entered the 'solid' area of the phase diagram). So if the above mentioned condensation nuclei (that were responsible for the condensation of the water vapor) are appropriate for ice nucleation, then they will now cause the undercooled droplets to freeze. See next Figure.
Figure above : (Approximate) Phase diagram of H2O (water) as a one-component system (C = 1). The phases are Ice, Water and Water vapor. A = triple point. Blue area signifies the stability area of the liquid phase.
The Figure describes, in addition to the first stage (explained above), the second stage in the formation of snow, namely the solidification of the water droplets.
When the temperature of the water droplets is lowered below the normal freezing point (in the Figure all the way down to t4 ), the droplets will not readily freeze despite the low temperature. The system has (again) become unstable. But as soon as appropriate ice nucleation particles are present, the droplets will spontaneouly freeze. A supercooled cloud droplet may freeze around -100C (140F) if it contains an average dust particle, or perhaps as high as -60C (210F) for the best ice nuclei (LIBBRECHT, op. cit. p.62). These frozen drops are, however, not yet snowflakes.
The third and last stage of the formation of snowflakes consists in the accumulation of ice onto the frozen droplets directly from the surrounding water vapor. Only now real snow crystals are formed. So, once an individual droplet freezes into a microscopic ice particle, it grows by condensing water vapor from the air, thus forming a full-fledged snow crystal. The snow crystal grows as it floats through the cloud. After some tens of minutes the snow crystal will have grown large enough that gravity pulls it to the ground.
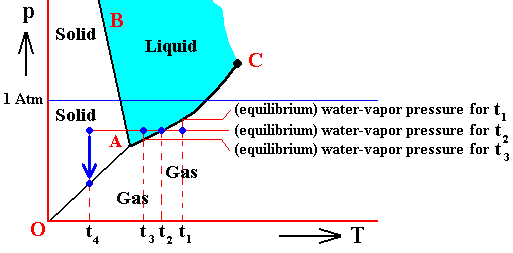
Figure above : (Approximate) Phase diagram of H2O (water) as a one-component system (C = 1). The phases are Ice, Water and Water vapor. A = triple point. Blue area signifies the stability area of the liquid phase.
The Figure describes, in addition to the first and second stages (explained above), the third and final stage in the formation of snow, namely the growth of the solidified water droplets, resulting in (growing) snowflakes.
The vapor from the remaining droplets, together with remaining water vapor that was still present, precipitate onto the frozen droplets and onto the already existing snowflakes, lowering in this way the (actually prevailing) vapor pressure, until equilibrium between ice and water vapor is established, as indicated by the vertical arrow in the diagram. This equilibrium consists in the actual prevailing water vapor pressure becoming equal to the equilibrium vapor pressure of ice at the given temperature. The growth of snowflakes, i.e. their increase in size in virtue of the deposition of water molecules, reflects the movement of the system toward this equilibrium (which will probably not actually be reached).
This concludes our discussion of the formation of snow crystals, in terms of a one-component thermodynamic system, involving three phases, namely ice, liquid water and water vapor (And indeed because this system has a triple point (where, consequently F = 0), where three phases are coexisting (P = 3), it follows, according to the phase rule, that C = 1, i.e. that we have to do with a one-component system).
Two-component systems
In addition to the above considered one-component systems (C = 1), there are two-component systems (C = 2), which we will consider very briefly.
Generally we get, according to the phase rule P + F = C + 2, for two-component systems (because C = 2), P + F = 4. So the number of phases plus the number of degrees of freedom equals four.
If we have to do with an invariant equilibrium (F = 0), then P = 4, i.e. the number of phases is four. So in the case of the presence of four phases the system is completely determined, i.e. one cannot change either pressure or temperature or volume or concentration of the phases (with respect to the latter, that means (one cannot change) their composition), without disturbing the equilibrium of the invariant system.
Three- and Multiple-component systems
Generally we get, according to the phase rule P + F = C + 2, for three-component systems (because C = 3), P + F = 5. So the number of phases plus the number of degrees of freedom equals five.
This leads, for the invariant equilibrium (F = 0) to a quintupel point with five different phases. The monovariant equilibrium (F = 1) possesses four phases.
Multi-component systems consist of four or more independent components. We will not discuss them further.
This concludes our consideration of the theory of phases. We have emphasized one-component systems, because having in mind simple crystallization processes. In such a process crystals of a single given substance appear from their melt, solution or vapor. This is a phase transition from either a liquid phase or a gas phase into the solid phase. Also the reverse processes are automatically considered : melting, dissolution and evaporation. The theory of phases considers the general conditions for the existence of these phases. Where (next document) we come to speak about the very generation of crystals (for which the mentioned conditions are necessary to begin with), we will consider how crystallization gets started, because even when crystals of a given substance are in principle possible to exist, they often do not appear in the absence of some 'nudge', for instance the appearing (in the melt, solution or vapor) of crystal embryos of sufficiently large size. A very important feature that is involved in these matters is the surface energy of an incipient crystal. It contributes to the total Gibbs free energy, and must be counteracted by an appropriate decrease in free enegy of the crystal with respect to its melt, solution or vapor.
In the next document we will discuss (in an elementary way) the thermodynamics of the first stages of the generation of crystals (nucleation conditions), and with that concluding the discussion about thermodynamics as one of the preparations to outlining the repertoire of the crystal analogy.
e-mail :
To continue click HERE for further study of the Theory of Layers, Part XXIX Sequel-14.